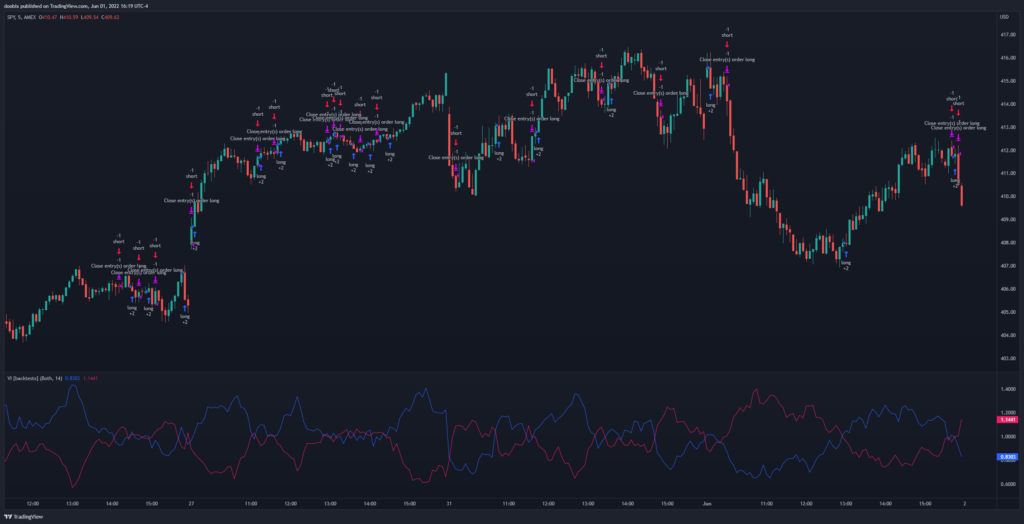
The Vortex Indicator is made up of two lines (one for uptrend and one for downtrend) and are plotted on a subchart. These lines are calculated using the highs and lows of the stock over the last N period, divided by the average true range over the last N period.
For this strategy, we will enter a long position when the VI+ line crosses over the VI- line, meaning there is an uptrend, and we will exit the position when the VI+ line crosses under the VI- line. When shorting, we simply do the opposite: enter a short position when the VI- line crosses over the VI+, which means there is a downtrend, and exit when the VI- line crosses under the VI+ line.
 Vortex Indicator strategy for the SPY on the 5min timeframe
Results
Testing this strategy on the SPY has returned the following profit factors:
- 1min: 0.942
- 5min: 1.146
- 15min: 1.08
- 30min: 0.976
- 1hour: 1.079
- 4hour: 1.081
- 1day: 0.897
- Average: 1.029
This strategy works best on the 5 minute timeframe, but overall its average profit factor is pretty low. Adding a 200 moving average could help improve the score, but we’ll test that in another time. Remember, different ticker symbols can provide different results.
TradingView Script
Try the Vortex Indicator strategy for yourself on TradingView: https://www.tradingview.com/script/ckNGG40k-Vortex-Indicator-backtestx/
Test with your own tickers and timeframes to see how well it works!