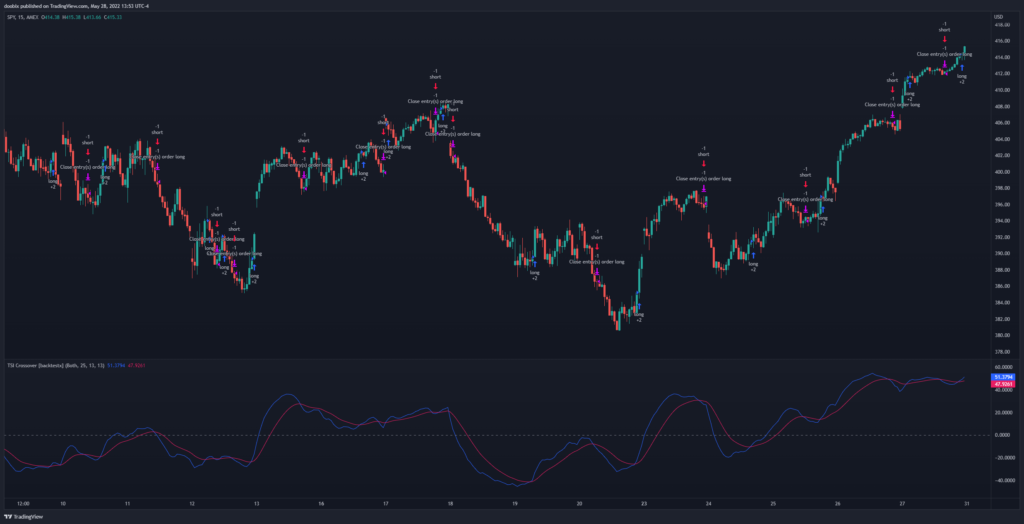
The True Strength Index is a momentum oscillator used for identifying trends and reversals. When the TSI has a positive value, it means the stock is bullish, and a negative value means the stock is bearish. Also, overbought and oversold conditions are signaled when the TSI crosses over/under the signal line. This is similar to the Moving Average Convergence Divergence (MACD) indicator, but they have different formulas and do not give the same signals.
The strategy for this indicator will be: enter long when the TSI crosses over the signal line, and exit long when TSI crosses under. Shorting will be the opposite: enter short when the TSI crosses under the signal line, and exit short when TSI crosses over.
 True Strength Index strategy for the SPY on the 15min timeframe
Results
Testing this strategy on the SPY has returned the following profit factors:
- 1min: 0.919
- 5min: 1.062
- 15min: 1.198
- 30min: 1.132
- 1hour: 0.984
- 4hour: 1.081
- 1day: 0.949
- Average: 1.046
This strategy works best on the 15 minute timeframe. Remember, different ticker symbols can provide different results.
TradingView Script
Try the TSI crossover strategy for yourself on TradingView: https://www.tradingview.com/script/nnzF3StY-True-Strength-Index-Crossover-backtestx/
Test with your own tickers and timeframes to see how well it works!