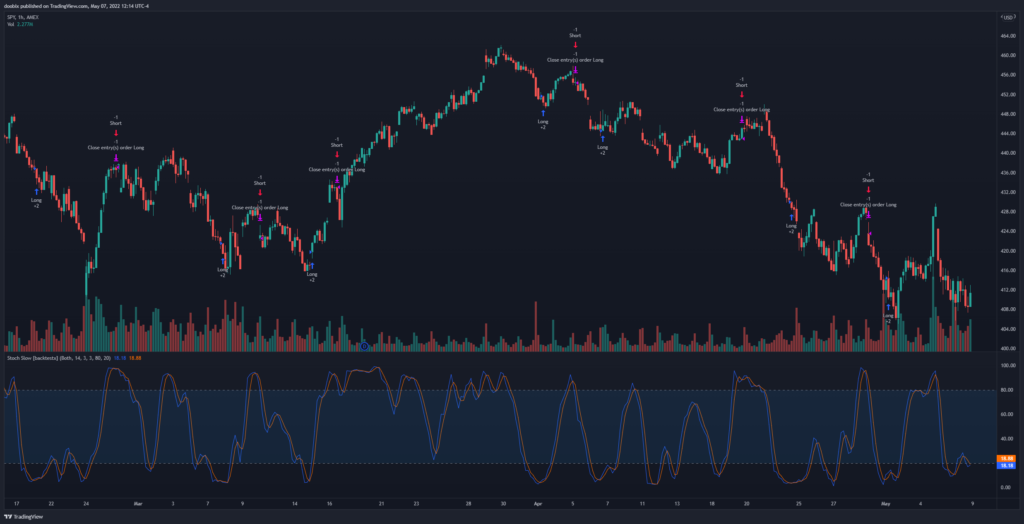
The stochastic slow indicator is an oscillator that shows the momentum of a stock price. It consists of 2 lines, the %K and the %D, that ranges from 0 to 100. The stock is in bullish momentum if it is above 80, and in bearish momentum if it is below 20.
For this strategy, we enter long when the %K line crosses over the %D line while it is below 20, which signifies that the bearish momentum is switching to bullish. The exit is when the %K line is crossing under the %D line while it is above 80, which means the bullish momentum is switching to bearish. For shorting, simply do the opposite: enter short on the long exit, and exit on the long entry.
 Stochastic Slow strategy for the SPY on the 1hr timeframe
Results
Testing this strategy on the SPY has returned the following profit factors:
- 1min: 1.018
- 5min: 0.897
- 15min: 0.806
- 30min: 0.864
- 1hour: 1.046
- 4hour: 0.872
- 1day: 0.956
- Average: 0.923
The Stochastic Slow strategy works best on the 1 hour timeframe, but the profit factor is quite low and there are other strategies that give better results. Relying on the stochastic oscillator by itself may not be a good idea and pairing it with another indicator could improve the results, which we can look more into in the future. But remember, different ticker symbols can provide different results.
TradingView Script
Try the Stochastic Slow strategy for yourself on TradingView: https://www.tradingview.com/script/ngsmJCPH-Stochastic-Slow-backtestx/
Test with your own tickers and timeframes to see how well it works!