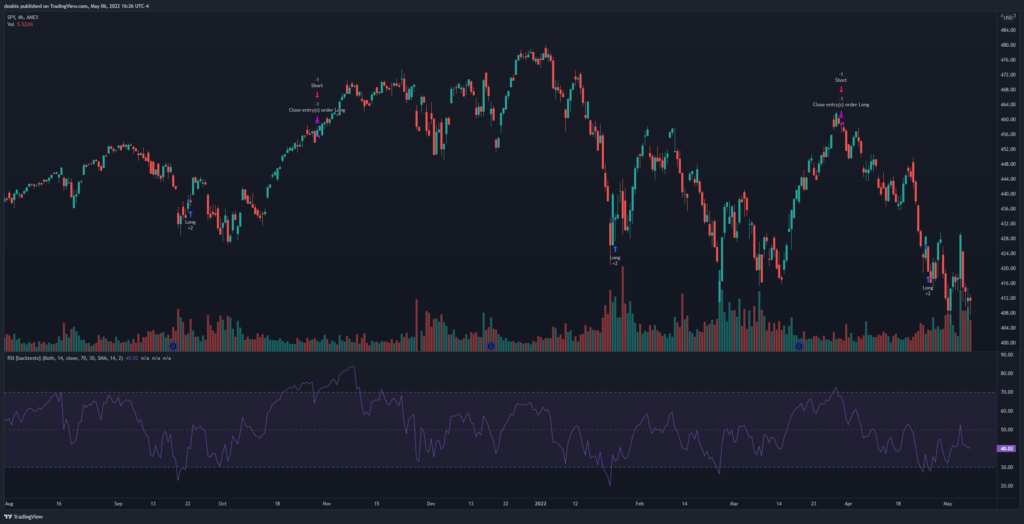
The relative strength index (RSI) is a momentum indicator that tells us when a stock is overbought or oversold. It only has a single line that moves in a range between 0 and 100, with 30 or below being the oversold area and 70 or above being the overbought area.
For this strategy, we enter long when the RSI is in the oversold area and it crosses above 30 as that indicates there is bullish momentum. The exit criteria is when the RSI is in the overbought area and it crosses below 70, meaning bearish momentum is starting. Do the opposite for shorting: enter short when RSI is crossing below 70, and exit short when RSI is crossing above 30.
 RSI strategy for the SPY on 4hr timeframe
Results
Testing this strategy on the SPY has returned the following profit factors:
- 1min: 0.748
- 5min: 0.755
- 15min: 1.271
- 30min: 0.994
- 1hour: 1.129
- 4hour: 1.342
- 1day: 0.615
- Average: 0.979
The RSI strategy works best on the 4 hour and 15 minute timeframes. Remember, different ticker symbols can provide different results.
TradingView Script
Try the RSI strategy for yourself on TradingView: https://www.tradingview.com/script/T3PtQBpZ-Relative-Strength-Index-backtestx/
Test with your own tickers and timeframes to see how well it works!