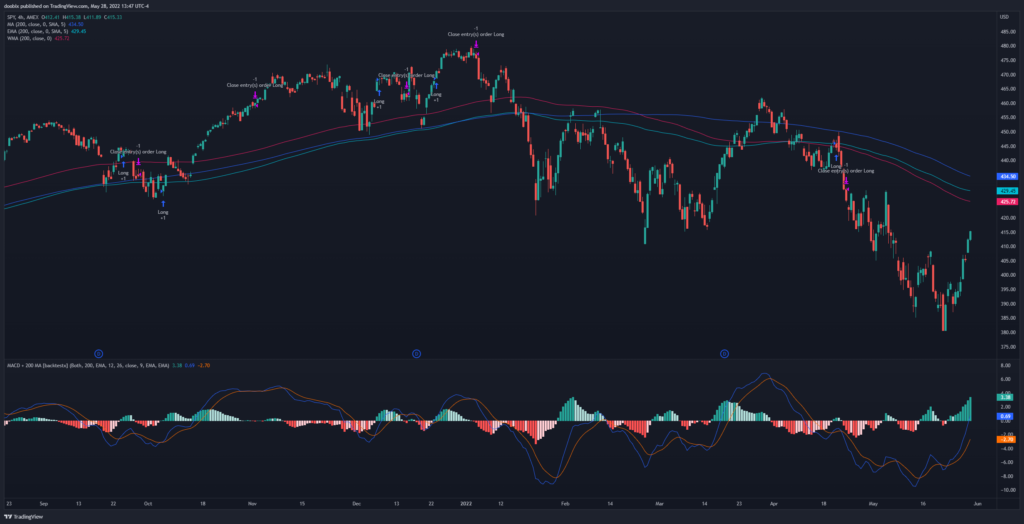
The Moving Average Convergence Divergence (MACD) is one of the most popular indicators out there. However, with the basic crossover strategy backtest, the results weren’t that spectacular with an average profit factor of only 1.059. Let’s try to improve it.
For the updated strategy, we will still follow the original crossover signals, but with 2 additional conditions to enter long: 1. MACD is below the zero line and 2. the price is above 200 moving average. For shorting, MACD must be above the zero line, and the price must be below the 200 moving average.
Because there’s a few different moving averages, I tested out 3 of them to combine with the MACD: the simple moving average (SMA), the exponential moving average (EMA), and the weighted moving average (WMA).
 MACD + 200 MA for the SPY on the 4hr timeframe
Results
Testing this strategy on the SPY has returned the following profit factors:
| Timeframe | MACD + 200 SMA | MACD + 200 EMA | MACD + 200 WMA |
| 1min | 0.912 | 0.875 | 0.927 |
| 5min | 1.289 | 1.38 | 1.33 |
| 15min | 1.162 | 1.329 | 1.46 |
| 30min | 1.501 | 1.402 | 1.472 |
| 1hour | 1.014 | 1.079 | 1.043 |
| 4hour | 1.153 | 1.149 | 1.023 |
| 1day | 1.788 | 1.874 | 2.109 |
| Average | 1.260 | 1.298 | 1.338 |
While adding any 200 moving average to the MACD shows improvement, the best one to use is the 200 WMA. The old average profit factor of 1.059 went up to 1.338, an increase of 0.279 (26.35%)! This trading strategy actually now has the highest average profit factor that has been backtested here so far.
TradingView Script
Try the MACD + 200 MA strategy for yourself on TradingView: https://www.tradingview.com/script/rCn3VmOZ-Moving-Average-Convergence-Divergence-200-MA-backtestx/
Test with your own tickers and timeframes to see how well it works!