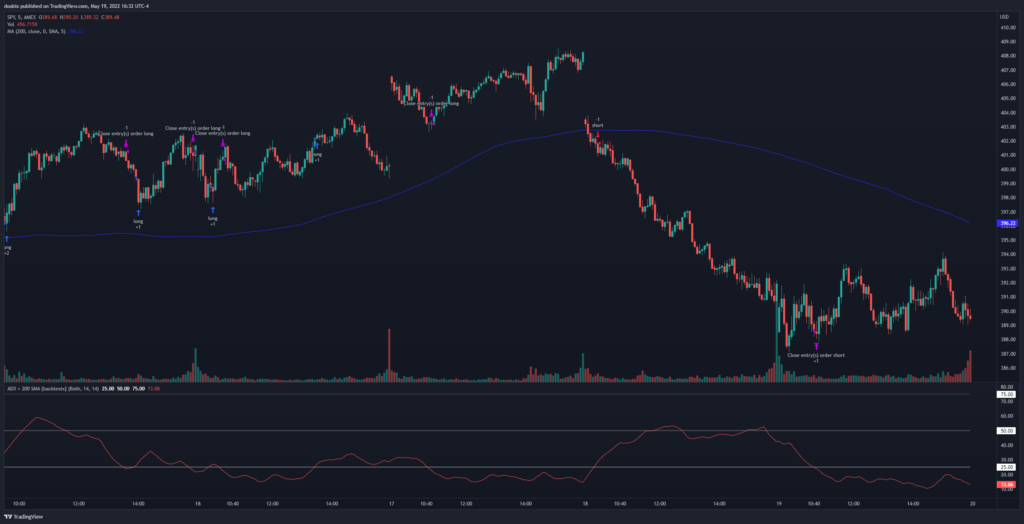
The ADX indicator is used to show the strength of a trend. It is plotted in a subchart with a line that goes from 0 to 100. When the ADX value is under 25, there is no trend or the trend is a weak one. Above 25 means there’s a strong trend, with 50+ being very strong, and 75+ extremely strong.
This indicator cannot be used alone as it does not show the trend direction, so we must pair it with another indicator. In this case, we’ll use the 200 simple moving average with the ADX. When price is above the 200 SMA, it means the trend is bullish, and when price is below the 200 SMA, it means the trend is bearish.
So the strategy is to wait for the ADX value to go above 25, and enter long if the price is above the 200 SMA. Once the ADX indicator drops below 25, we exit long. If shorting, enter short if the price is below the 200 SMA and the ADX value is 25+, and exit short when ADX goes below 25.
 ADX + 200 SMA strategy for the SPY on the 5min timeframe
Results
Testing this strategy on the SPY has returned the following profit factors:
- 1min: 1.141
- 5min: 1.549
- 15min: 1.061
- 30min: 0.932
- 1hour: 0.944
- 4hour: 0.831
- 1day: 0.954
- Average: 1.059
This strategy works best on lower timeframes such as the 5 minute and the 1 minute timeframes. Remember, different ticker symbols can provide different results.
TradingView Script
Try the ADX + 200 SMA strategy for yourself on TradingView: https://www.tradingview.com/script/k149O7RW-Average-Directional-Index-200-SMA-backtestx/
Test with your own tickers and timeframes to see how well it works!