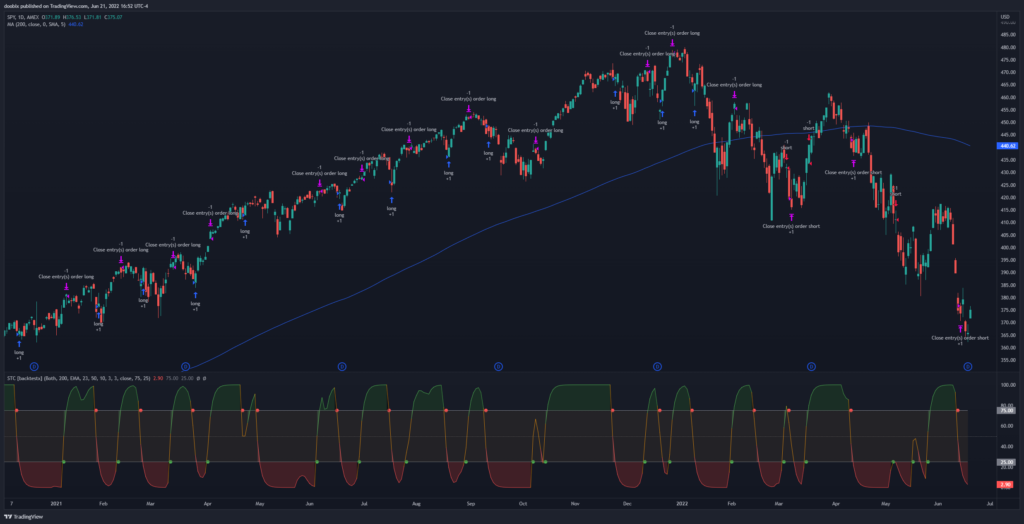
The Schaff Trend Cycle indicator is similar to the Moving Average Convergence Divergence (MACD) indicator, but it provides faster signals by combining a cycle indicator to it. In return, we end up with an indicator that goes from 0 to 100, with 25 and 75 being the key levels of oversold and overbought.
When the STC is below 25 and it crosses over it, that signals a buy. Similarly, when the STC is above 75 and it crosses under it, it signals a sell.
We will improve trading with the STC by also using a 200 moving average to help us trade with the trend. The 200 SMA, EMA, and WMA will all be tested to see which one performs the best.
Long entry rules:
- Price must be above the 200 MA
- STC shows Buy signal
Long exit rules:
Short entry rules:
- Price must be below the 200 MA
- STC shows Sell signal
Short exit rules:
 STC + 200 EMA for the SPY on the daily timeframe
Results
Testing this strategy on the SPY has returned the following profit factors:
| Timeframe | STC | STC + 200 SMA | STC + 200 EMA | STC + 200 WMA |
| 1min | 0.951 | 0.887 | 0.869 | 0.87 |
| 5min | 0.974 | 1.031 | 1.117 | 1.049 |
| 15min | 0.959 | 0.995 | 0.987 | 1.032 |
| 30min | 0.883 | 0.892 | 0.888 | 0.899 |
| 1hour | 1.157 | 1.063 | 1.071 | 1.019 |
| 4hour | 0.831 | 1.054 | 1.082 | 0.935 |
| 1day | 1.294 | 1.821 | 1.856 | 1.683 |
| Average | 1.007 | 1.106 | 1.124 | 1.070 |
After testing this strategy, we can see that trading with only the STC leaves more to be desired with a profit factor that is barely above 1.0. Adding any 200 period moving average is better than none, but the best one is the 200 EMA (exponential moving average), on the daily time frame with a profit factor of 1.124.
TradingView Script
Try the Schaff Trend Cycle + 200 MA strategy for yourself on TradingView: https://www.tradingview.com/script/P2eLrij8-Schaff-Trend-Cycle-backtestx/
Test with your own tickers and timeframes to see how well it works!