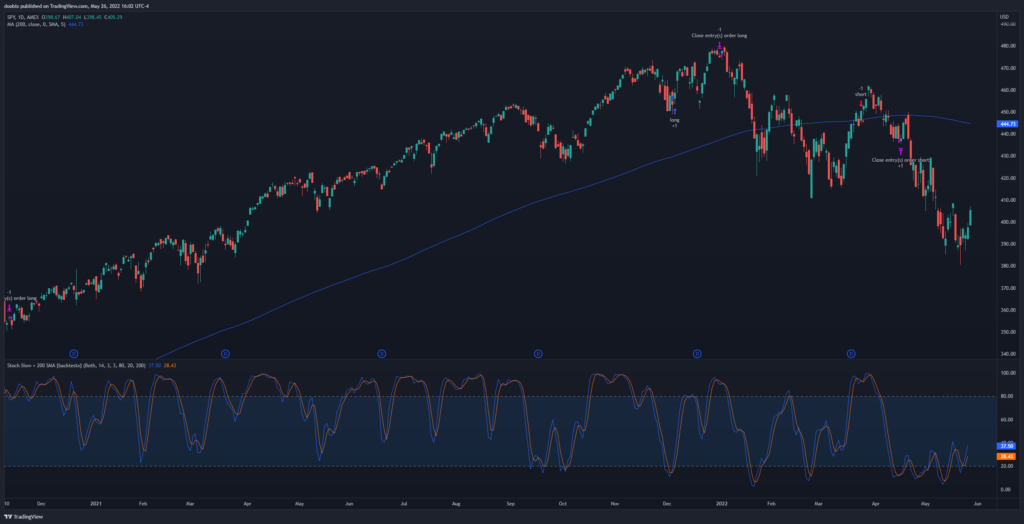
The Stochastic Slow is the worst indicator that has been backtested here so far, with an average profit factor of only 0.923. What if we try to improve it by adding a 200 simple moving average (SMA) to help trade with the trend?
The 200 SMA helps determine long term trends, where price above the line means bullish, and price below means bearish. So with this updated strategy, we’ll only enter long trades when we get a double confirmation with a bullish stochastic signal and a bullish trend, and only enter short trades when there’s a bearish stochastic signal and a bearish trend.
 Stochastic Slow + 200 SMA strategy for the SPY on the daily timeframe
Results
Testing this strategy on the SPY has returned the following profit factors:
- 1min: 1.245
- 5min: 1.223
- 15min: 0.83
- 30min: 0.969
- 1hour: 0.981
- 4hour: 1.032
- 1day: 1.378
- Average: 1.094
This strategy has been dramatically improved by adding the 200 SMA. Its old average profit factor of 0.923 went up to 1.094, an increase of 0.171 (18.53%)! Remember, different ticker symbols can provide different results.
TradingView Script
Try the Stochastic Slow + 200 SMA strategy for yourself on TradingView: https://www.tradingview.com/script/GmrhuuwT-Stochastic-Slow-200-SMA-backtestx/
Test with your own tickers and timeframes to see how well it works!