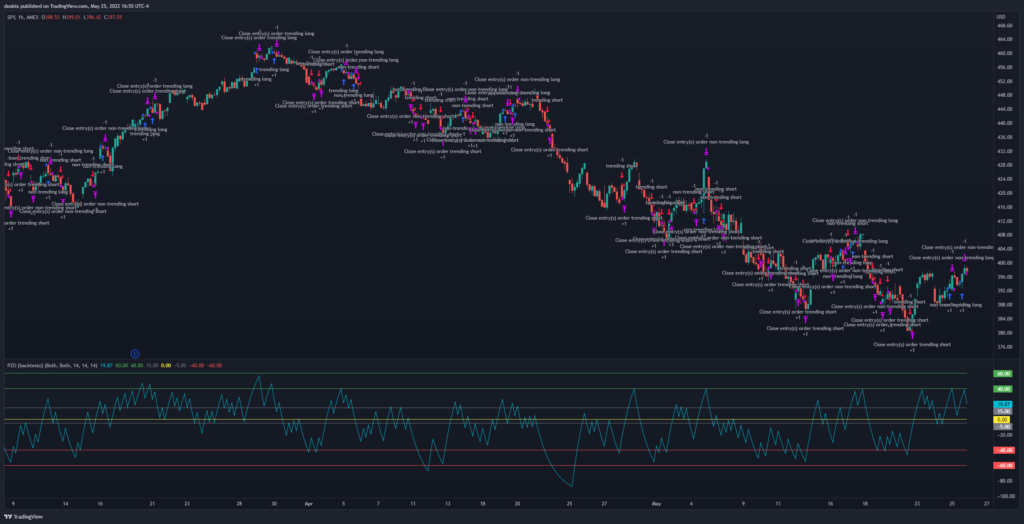
The Price Zone Oscillator (PZO) calculates the ratio between 2 exponential moving averages to create overbought and oversold levels. There are a few key levels to look at with this indicator: 15, 40, 60, and -5, -40, and -60. It is recommended to use the Average Directional Index (ADX) together with the PZO because the ADX shows how strong the price trend is, if there is any.
The strategy with PZO + ADX is:
- In a trending market (ADX > 18):
- PZO crosses over 40: enter long
- PZO crosses under 60 from above: exit long
- PZO crosses under -40: enter short
- PZO crosses over -60 from below: exit short
- In a non-trending market (ADX < 18):
- PZO crosses over 15: enter long
- PZO crosses under 40 from above: exit long
- PZO crosses under -5: enter short
- PZO crosses over -40 from below: exit short
 PZO + ADX strategy for the SPY on the 1hr timeframe
Results
Testing this strategy on the SPY has returned the following profit factors:
- 1min: 1.022
- 5min: 0.918
- 15min: 1.025
- 30min: 0.886
- 1hour: 1.152
- 4hour: 0.915
- 1day: 0.984
- Average: 0.986
This strategy works best on the 1 hour timeframe, but overall it’s pretty bad with an average profit factor of less than 1.0. Remember, different ticker symbols can provide different results.
TradingView Script
Try the Price Zone Oscillator + Average Directional Index strategy for yourself on TradingView: https://www.tradingview.com/script/TxPGW2EH-Price-Zone-Oscillator-Average-Directional-Index-backtestx/
Test with your own tickers and timeframes to see how well it works!