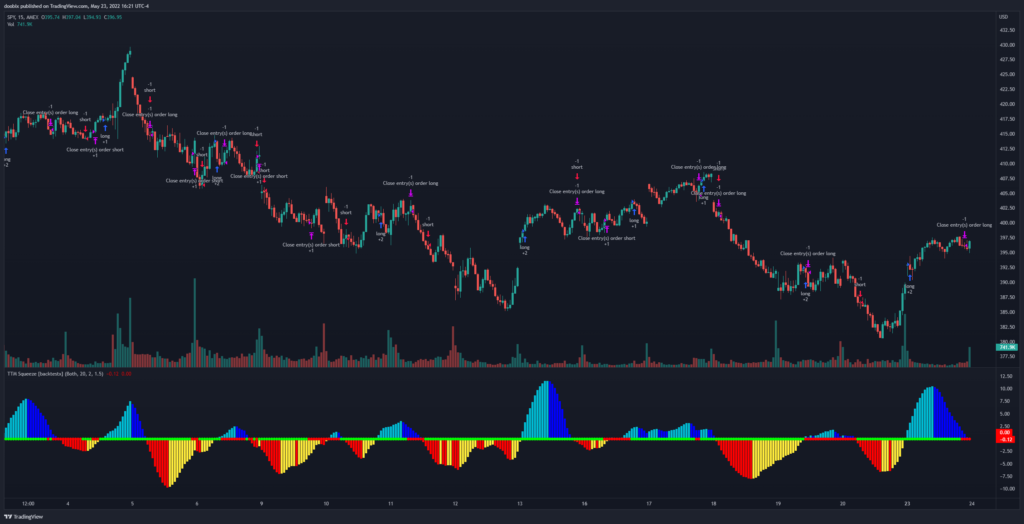
The TTM Squeeze is a volatility and momentum indicator. For the momentum part, there is an oscillator that moves above and below the zero line. Above zero means there is bullish momentum, and below zero means there is bearish momentum.
For the volatility part, the combination of Bollinger Bands and Keltner Channels are used. If the Bollinger Bands are inside the Keltner Channels, this is known as the “squeeze” and it means there is low volatility — price is probably moving in a range. Once the Bollinger Bands start to exit out of the Keltner Channels, it means the squeeze is releasing and volatility is high — price is likely to break out of the range. The status of the squeeze is shown with dots in the indicator: red dots mean there is a squeeze, and green dots mean the squeeze has released.
So in this strategy, we will enter long only when the squeeze has released and if there is bullish momentum. When the momentum becomes bearish or when the squeeze is happening, we exit long.
Similarly, for shorting, we will enter short when the squeeze has released and there is bearish momentum. We exit short when the momentum switches to bullish or when it starts to squeeze again.
 TTM Squeeze strategy for the SPY on the 15min timeframe
Results
Testing this strategy on the SPY has returned the following profit factors:
- 1min: 0.937
- 5min: 1.025
- 15min: 1.269
- 30min: 0.994
- 1hour: 1.011
- 4hour: 0.833
- 1day: 0.892
- Average: 0.994
This strategy works best on the 15 minute timeframe, but overall has a pretty low average profit factor. Remember, different ticker symbols can provide different results.
TradingView Script
Try the TTM Squeeze strategy for yourself on TradingView: https://www.tradingview.com/script/9pVJAc9l-TTM-Squeeze-backtestx/
Test with your own tickers and timeframes to see how well it works!