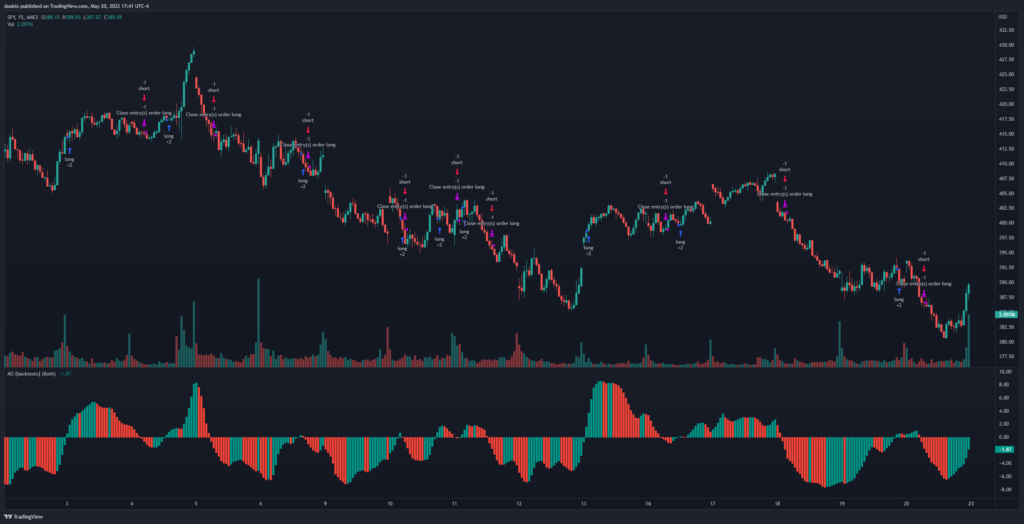
The Awesome Oscillator is an indicator displayed in a subchart that shows the momentum of a stock. It starts with a zero line, and a histogram is calculated using the difference between the 34-period and the 5-period simple moving averages. This creates a histogram above or below the zero line — above meaning bullish momentum, and below meaning bearish momentum.
With this strategy, we simply enter long when the histogram goes above the zero line, and exit when it flips below. Similarly, we enter a short position when the histogram goes below the zero line, and exit when it flips above.
 Awesome Oscillator strategy for the SPY on the 15min timeframe
Results
Testing this strategy on the SPY has returned the following profit factors:
- 1min: 1.082
- 5min: 1.084
- 15min: 1.32
- 30min: 1.058
- 1hour: 0.968
- 4hour: 1.01
- 1day: 0.894
- Average: 1.059
This strategy works best on lower timeframes, especially on the 15 minute timeframe. Remember, different ticker symbols can provide different results.
TradingView Script
Try the Awesome Oscillator strategy for yourself on TradingView: https://www.tradingview.com/script/vx4C4dsy-Awesome-Oscillator-backtestx/
Test with your own tickers and timeframes to see how well it works!