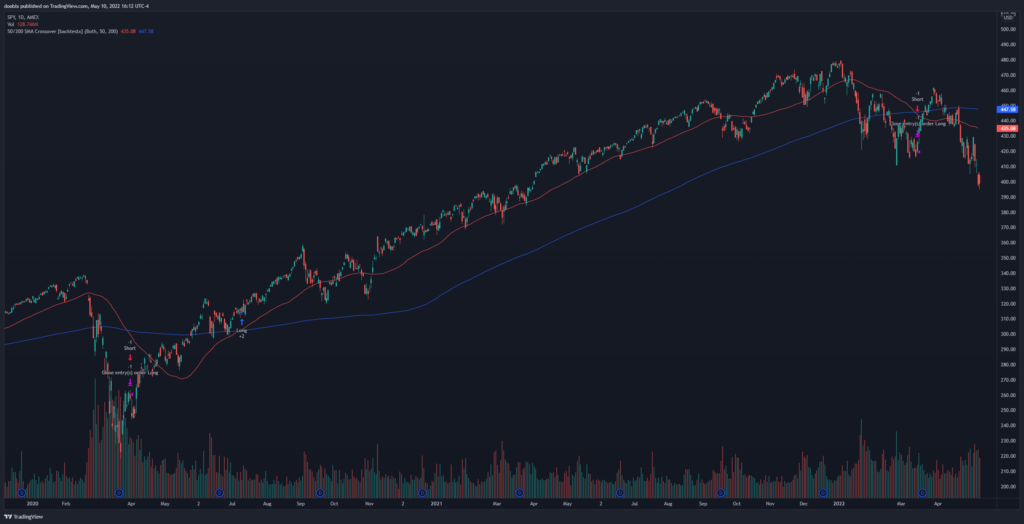
Here is another crossover strategy, very similar to the 9/21 EMA crossover strategy. This one uses 2 simple moving averages: the 50 SMA and the 200 SMA. When the 50 crosses over the 200, it means a bullish trend is happening. And when the 50 crosses under the 200, it means a bearish trend is happening.
So the strategy with these 2 indicators is: enter long when the 50 SMA crosses over the 200 SMA, and exit when the 50 SMA crosses under the 200 SMA. For shorting, do the exact opposite.
 50/200 SMA crossover strategy for the SPY on the daily timeframe
Results
Testing this strategy on the SPY has returned the following profit factors:
- 1min: 1.236
- 5min: 1.219
- 15min: 0.868
- 30min: 1.176
- 1hour: 1.079
- 4hour: 1.137
- 1day: 2.441
- Average: 1.308
This strategy works great on almost every single timeframe, with the best being on the daily. Also, this has the best average profit factor out of all the other trading strategies tested here. Remember, different ticker symbols can provide different results.
TradingView Script
Try the 50/200 SMA crossover strategy for yourself on TradingView: https://www.tradingview.com/script/dnenPgLI-50-200-SMA-Crossover-backtestx/
Test with your own tickers and timeframes to see how well it works!