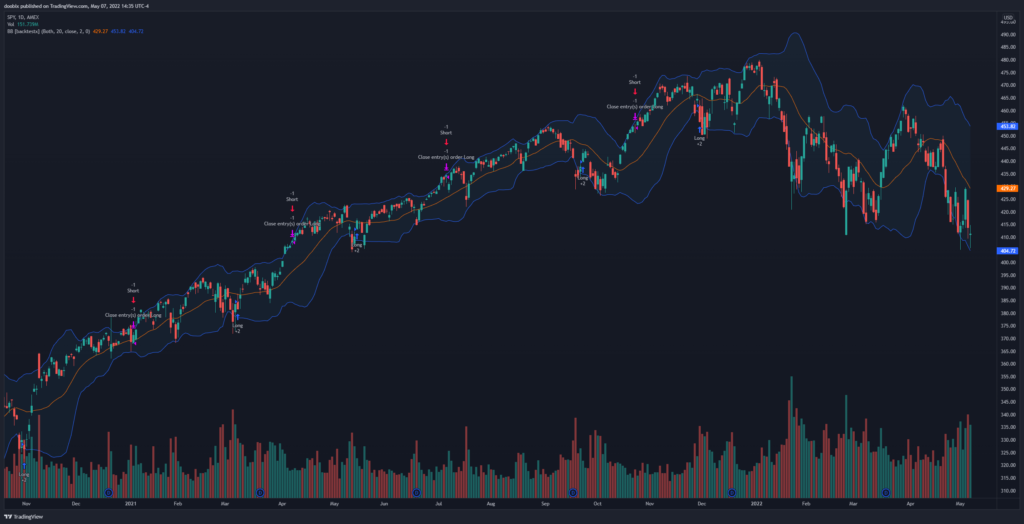
The Bollinger Bands are two lines plotted 2 standard deviations away from the simple moving average. When the stock price moves towards the upper band, it is getting overbought, and when the stock price moves towards the lower band, it is getting oversold.
The strategy with this indicator is to enter a long position when the current price is crossing above the lower band, which means buyers are starting to buy the stock. When the price starts crossing under the upper band, it means sellers are starting to sell, so that is the exit location. For shorting, simply do everything opposite: enter a short position when the price crosses under the upper band, and exit when the price crosses above the lower band.
 Bollinger Bands strategy for the SPY on the daily timeframe
Results
Testing this strategy on the SPY has returned the following profit factors:
- 1min: 1.182
- 5min: 0.956
- 15min: 0.709
- 30min: 1.087
- 1hour: 1.336
- 4hour: 1.091
- 1day: 1.672
- Average: 1.148
The Bollinger Bands strategy works on different timeframes, but the best ones were on the daily and 1 hour timeframes. Remember, different ticker symbols can provide different results.
TradingView Script
Try the Bollinger Bands strategy for yourself on TradingView: https://www.tradingview.com/script/pALPoW4i-Bollinger-Bands-backtestx/
Test with your own tickers and timeframes to see how well it works!